Financial Highlights
Financial Highlights
(Note: Reflects amounts attributable to continuing operations. 2017 was a 53-week year.)
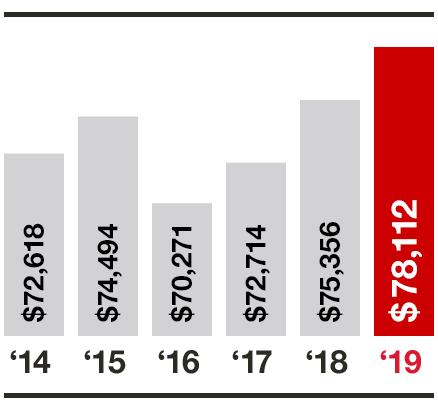
| 2017 | $72,714 |
| 2018 | $75,356 |
| 2019 | $78,112 |
| 2020 | $93,561 |
| 2021 | $106,005 |
| 2022 | $109,120 |
2019 Growth: 3.7%
Five-year CAGR: 1.5%
Operating Income In Millions
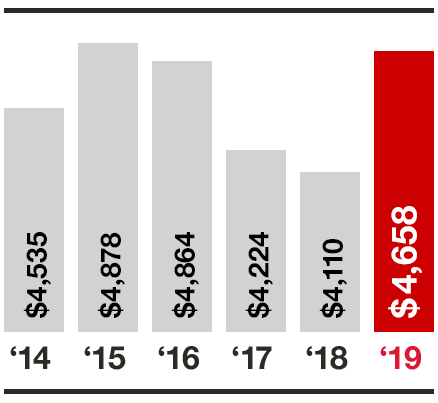
| 2017 | $4,224 |
| 2018 | $4,100 |
| 2019 | $4,658 |
| 2020 | $6,539 |
| 2021 | $8,946 |
| 2022 | $3,848 |
2019 Growth: 13.3%
Five-year CAGR: 0.5%
Net Earnings In Millions
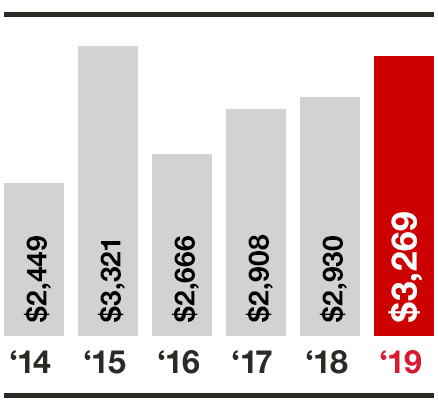
| 2017 | $2,908 |
| 2018 | $2,930 |
| 2019 | $3,269 |
| 2020 | $4,368 |
| 2021 | $6,946 |
| 2022 | $2,780 |
2019 Growth: 11.6%
Five-year CAGR: 5.9%
Diluted EPS
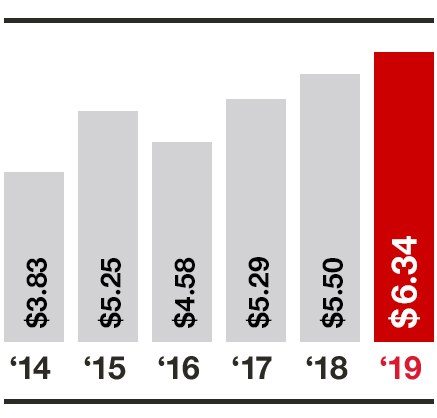
| 2017 | $5.29 |
| 2018 | $5.50 |
| 2019 | $6.34 |
| 2020 | $8.64 |
| 2021 | $14.10 |
| 2022 | $5.98 |
2019 Growth: 15.4%
Five-year CAGR: 10.6%
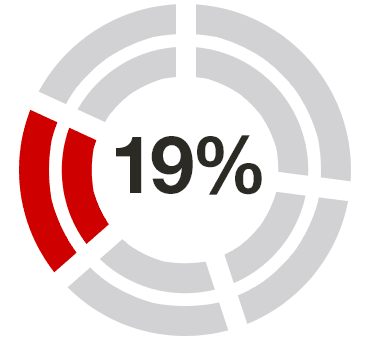
Total 2019 Sales: $77,130 Million
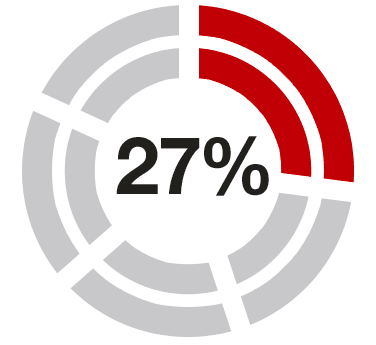
Beauty & Household Essentials
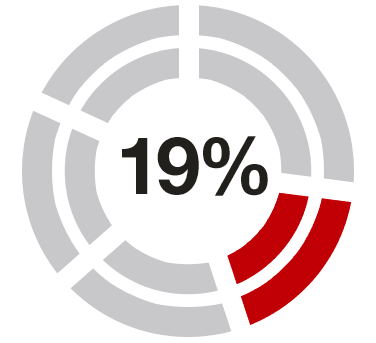
Food & Beverage
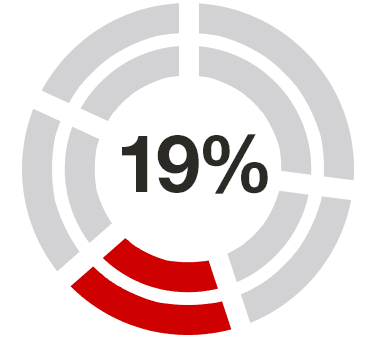
Home Furnishings & Décor
Hardlines